Integrating AI as a path to product optimisation, not the product itself
Three stages of AI: one validated, one partially invalidated, one pivot.
Role
Sole product designer, partnered with two PMs, marketing and engineering. I owned the design surface end-to-end and drove the Stage 3 pivot from research to ship.
The two PMs owned prompt and template design in collaboration with engineering. I owned everything on the design surface, and I ran the between-stage research on my own initiative.
Problem
Standalone AI buttons reached only 10–13% discovery, less than half what we’d expect from prominent UI. The structural problem underneath: native Vidalytics features get discovered at half the rate of industry-standard ones while adoption-of-discovered is identical. Discovery is the gate, not value.
Solution
Stage 1 — AI inside an existing feature: one-click captions. Stage 2 — AI as standalone surfaces: a Script Analyser and a Vid Stats chat. Stage 3 — AI integrated into dashboards users already visit, a pivot I drove from research between stages.
Outcome
Stage 1 validated the friction hypothesis (+48% relative). Stage 2 tested standalone AI twice: as an open chat it saw good discovery and weak activation, and adding quick actions took adoption to53.13% on the surface that got them. Stage 3 moved AI into the surfaces users already open — insights reached20.13% adoption among eligible users, while experiment suggestions underperformed and pointed at placement as the reason.
Read as one line: the model was never the variable. Each stage narrowed what actually decides whether an AI feature gets used — first that it must remove work rather than add a destination, then that it must say what it does, then that it must appear where the user is already deciding something.
The structural problem AI was running against
Features unique to Vidalytics average12.34% discovery and27.26% adoption. Industry-standard features in the same product average24.81% and28.72%. Users find native features at half the rate; once they do, they stick at the same rate. AI was one lever tried against that.
Discovery and adoption, native vs. non-native features.
How these are defined and measured
Native features are unique to Vidalytics — Smart Vids, Experiments, Conversions, Training Centre, Segmentations. Non-native features are industry-standard tools also available in competing platforms.
Adoption is the share of users who used a feature consistently among those who discovered it, with the required use-per-period threshold defined individually per feature. The ~1.5% adoption difference is small enough that we treat the two groups as equivalent on adoption.
Why leadership picked AI, and why we shipped cheap
Two reasons: competitive parity, since direct competitors were rolling out AI features, and business impact, since AI was a plausible lever on feature engagement, value-per-action and retention. The target landed as: move feature engagement and value-per-action, with AI as one of several levers.
We had real hopes for each stage — these were genuine attempts at value, not hypothesis tests dressed up as features. But AI is still relatively unexplored for product integration in our kind of work, so we prioritised shipping cheap and learning between stages over heavy investment in any one approach.
Some of it was never going to be differentiation. By the time we shipped AI captions, multiple competitors had rolled out their own.
About Vidalytics
A profitable B2B platform, around 50 employees, roughly 2,200 monthly paying customers. Core audience: VSL marketers — businesses of varying scale, ecom brands and agencies whose livelihoods depend on video performance.
Stage 1 — AI as automation inside an existing feature
Hypothesis: captions had low adoption because setup effort was high. Remove the friction with one-click AI and more users will use them. AI as the way to use the feature, not a feature in itself.
Adoption went4.56% →6.77%, a48% relative lift — but still below our ~15% internal benchmark for embedded automation.
Frictionless AI is a real lever on features users already want. It doesn’t work on features users don’t see themselves in. That gap is the ceiling on what “easier” can do alone.
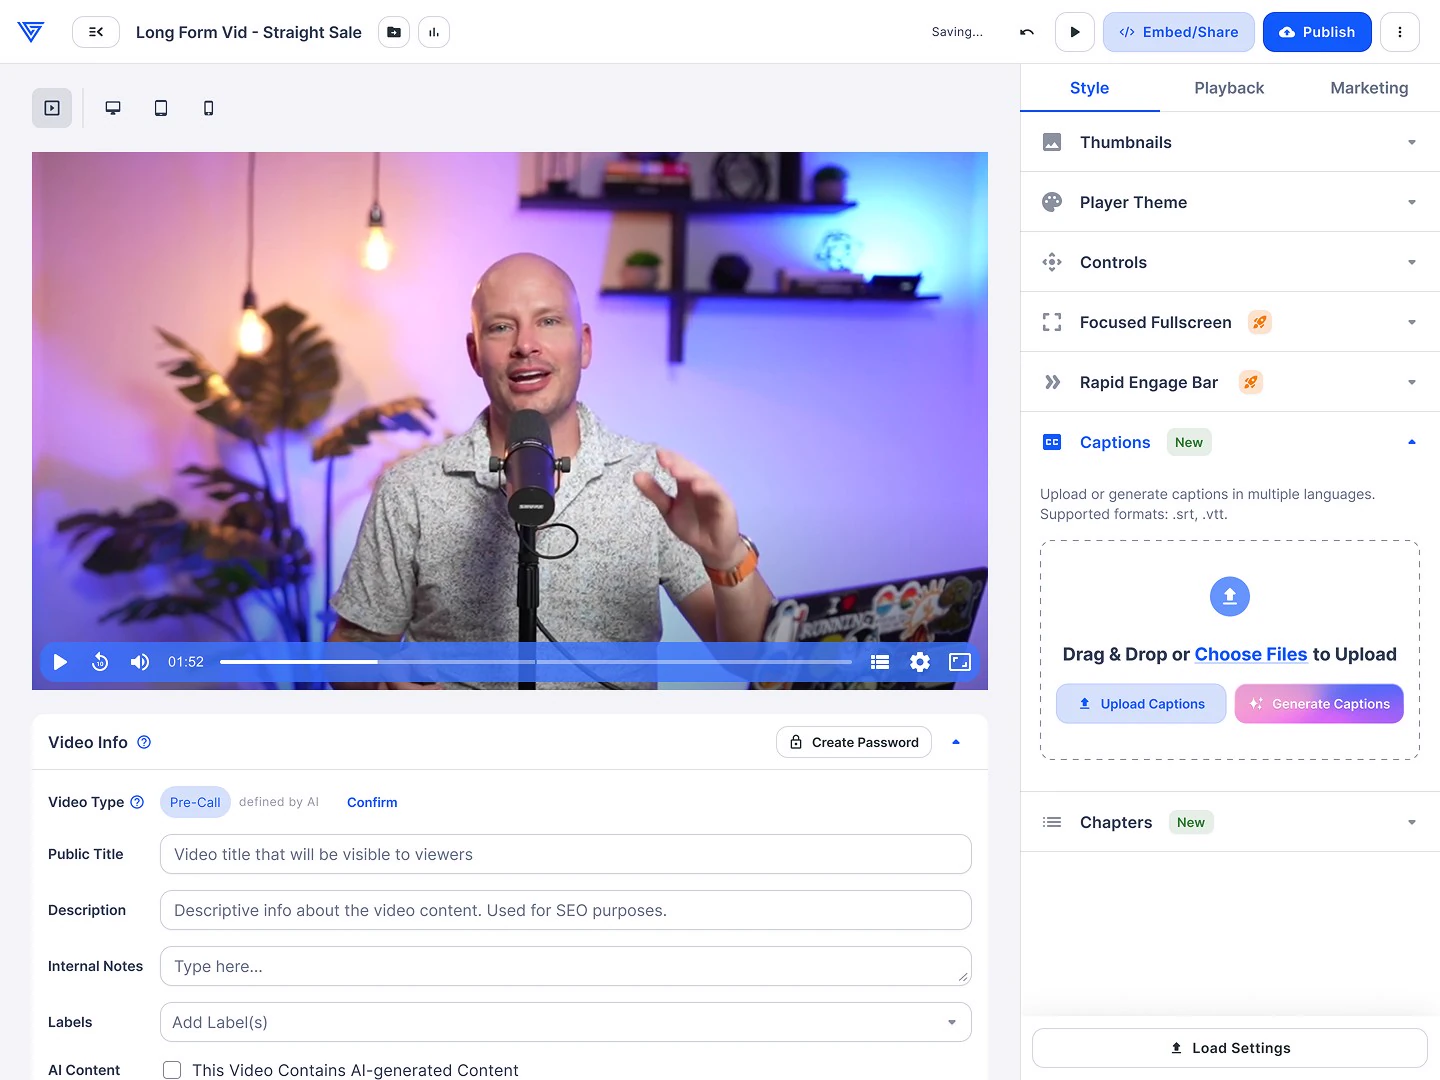
The AI generation button inside the captions flow.
Caption adoption, before vs after.
Two months starting two weeks after launch, compared against two months ending two weeks before launch. Counted as users who enabled the feature on at least one video.
Stage 2A — standalone AI, shipped as an open chat
Hypothesis: standalone AI surfaces could deliver value users couldn’t get elsewhere. Two shipped, both as an open chat and nothing else — a Script Analyser in vid settings, opened from a sidebar button, and Vids AI in vid stats, opened from a floating button. Vids AI went live on 9 September 2025, the Script Analyser on 19 December 2025.
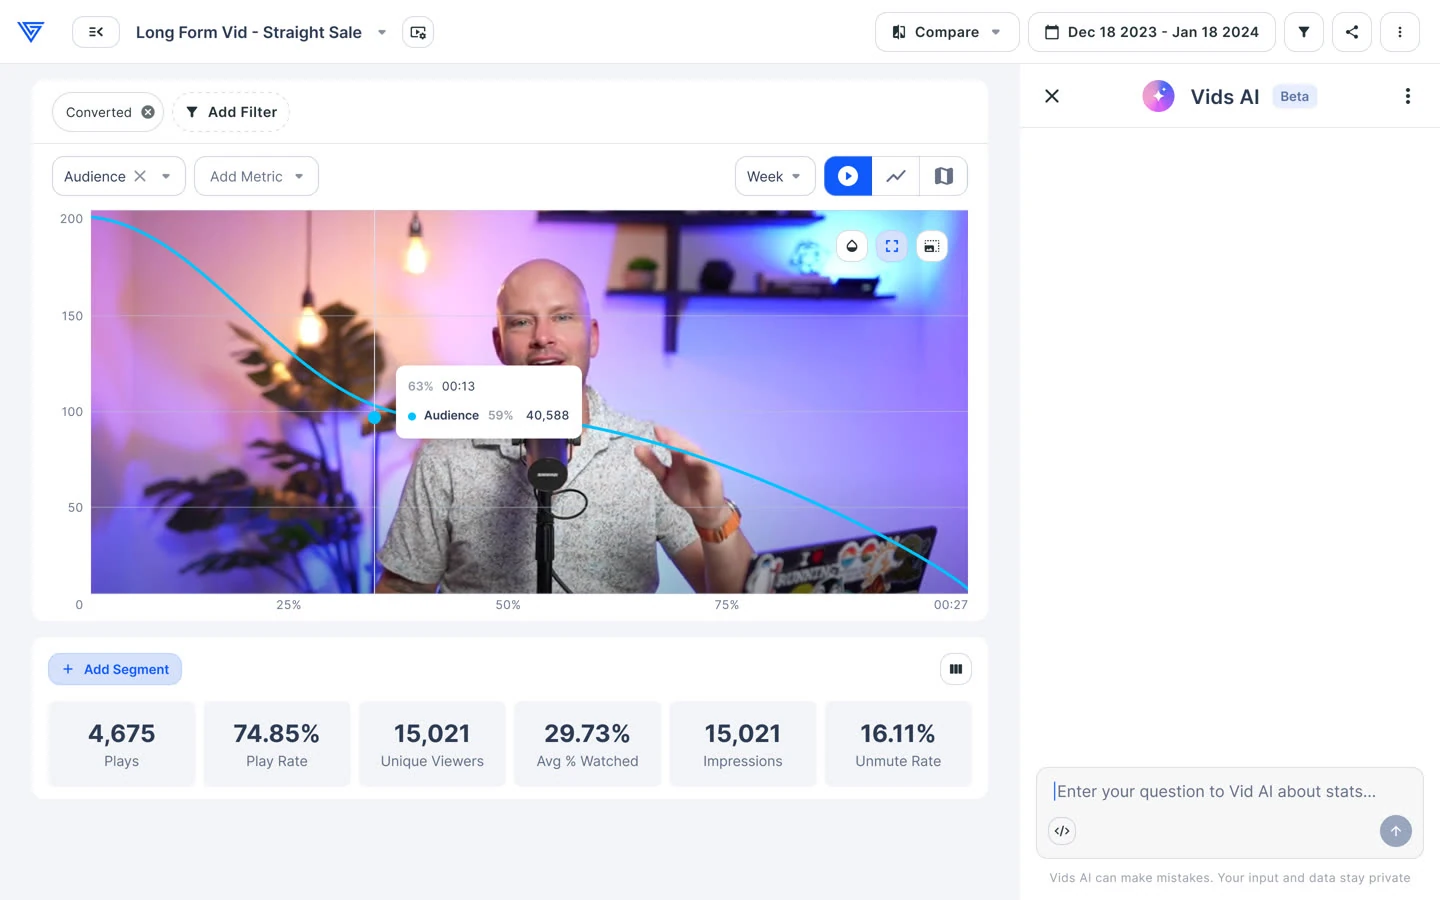
Vids AI as it first shipped: an input, and nothing telling you what to put in it.
The Script Analyser in vid settings — one job, and the button that does it.
Over the 27 weeks that followed, 237 users opened Vids AI and 173 of them got an answer back — roughly 9 users a week reaching the thing the feature exists to do. Discovery wasn’t the failure. Activation was.
The shape of the usage says the same. Threads averaged 1.70 responses, with a median of 1: most people asked one question and stopped. Of the users who opened it,77% got a first answer but only34% ever reached a second, and the stretch from opening to that second answer averaged 501 seconds. People were opening it with interest, typing one thing, and running out of ideas.
That is what an empty input does. It states no value proposition and demonstrates no capability, so the user has to invent the use case themselves — and mostly doesn’t. The result was low, and expected to be. Quick actions were in the plan from the start; shipping without them first was a sequencing call, to see what raw interest looked like before paying for the next layer and to give that layer something to be measured against.
Stage 2B — quick actions, and taking the chat away
Shipped 19 March 2026, to Vids AI only. The Script Analyser does exactly one thing, so its button already was the quick action; it needed no equivalent and didn’t change.
The first surface stopped being a chat. Named quick actions replaced it — Give Stats Summary, Check Trends, Drop-Off Audit, Top Segments, Benchmark Video — and the free-text box was removed from that layer entirely. Chat still exists, but only behind an action, for follow-up questions. The actions are static and deliberately advertise the whole capability set rather than a personalised subset; the answers behind them are generated from that video’s script and its data.
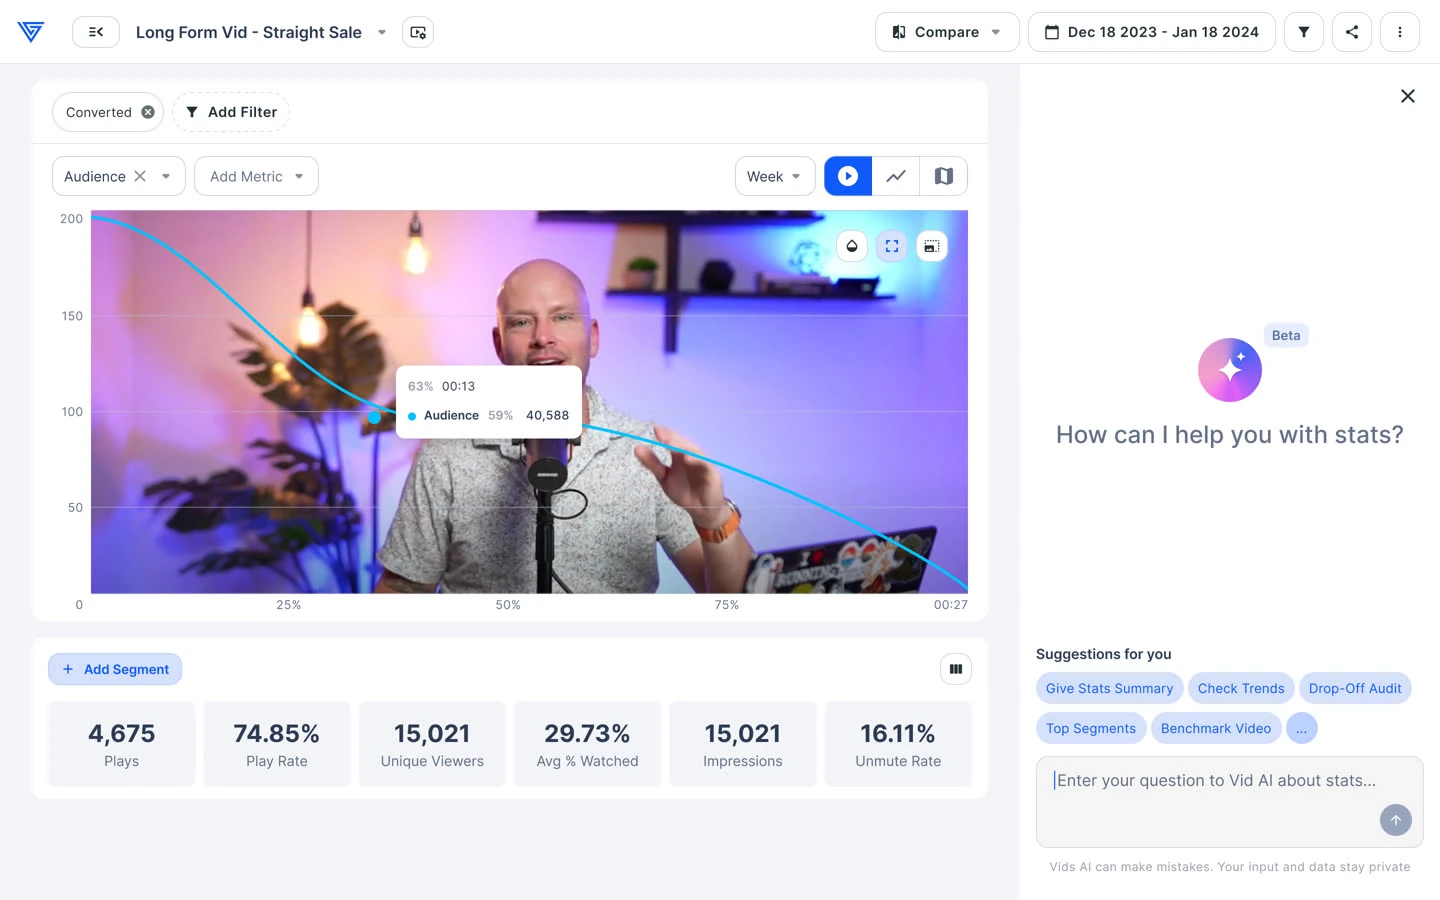
The same panel after Stage 2B. The question is now a list you pick from.
Picking an action, and the chat that opens behind it for follow-ups.
Exposure changed completely. The prompted surface put Vids AI in front of 1,060 users in six weeks, against 237 manual opens across the whole 27 weeks before it. Users actually receiving an answer went from about 9 a week to about 20.
But the conversion underneath it is the finding worth keeping. Of those 1,060 users,4.53% picked an option — and97.92% of the ones who did got an answer. The drop-off is at intent, not delivery: putting the surface in front of people is solved, deciding to use it is not.
The prompted surface, 19 March – 30 April 2026. Percentages are of users shown the prompt.
For the users who did engage, every depth measure improved. Responses per thread went 1.70 → 2.47, and responses per user 3.54 → 5.50.
Depth of use, before and after quick actions.
The time figures look wrong until you read them properly. The share of users reaching a second answer went from34% to74%, while the time taken to get there fell from 501 to 148 seconds. Engagement didn’t shrink — follow-ups became one click instead of one sentence, so people got more answers in less time.
Repeat use within the same week rose from50% to62%. Week-over-week retention did not move, sitting at roughly 6–11% in both periods. Quick actions made Vids AI stickier inside a working session; they did not yet make it a habit across weeks.
Measured separately across both surfaces, 27 March – 27 April 2026, discovery landed within ~2.5 points of each other (10.56% and13.01%) while adoption did not:21.05% for the analyser against53.13% for Vids AI.
The two surfaces side by side — same model, different framing.
Adoption means the share of users who fired at least one prompt in a month; a use is a prompt firing, not a panel opening.
What the split proved: the model was never the variable. The same model, behind the same button, performed differently only because one version said what it could do and the other didn’t. AI on its own delivers nothing — a user gets value from it once they understand precisely what it does and can see why they’d want it.
Caveats that belong with these numbers
The two periods are not the same length — 26.7 weeks before against 6.1 weeks after — so rates and per-week levels are comparable and raw totals are not.
Sessions are not reliably stitched in this project: vid_ai_summary_shown returns an identical count for total events and total sessions, so every event is being treated as its own session. There is therefore no trustworthy session-duration or messages-per-session metric, and both depth and time above are proxies — responses per thread, responses per user, and a one-hour funnel window.
The per-thread depth figure was only instrumented from January 2026, so that particular comparison is really January–March against March–April rather than the full period.
The prompted-surface events only exist after 19 March, so their earlier value is structurally zero rather than a real decline.
Three reads on the adoption gap
Both figures are acceptable against our internal benchmark —21.05% is fine,53.13% is excellent. The question was why the same model performed so differently by surface.
Settings is the wrong room for analysis. Our original reasoning was that vid settings is where everything about the video lives, and script falls under that. But users go to settings to configure, not to think.
The feature was too Vidalytics-native — users opened it without grasping what it offered.
“Script Analyser” didn’t communicate the value clearly enough.
All three likely contributed. Placement is the cheapest to test, so that’s where we’d start.
Does 2B rescue the standalone hypothesis?
Partly. A standalone surface can reach people if it explains itself, so “standalone AI can’t reach people” was too strong as stated. It does not fully rescue it:4.53% of the users we put it in front of chose to use it, and the ceiling is still set by whether they were coming to that page anyway. That is the argument Stage 3 acts on.
Where this sits against competitors
Our direct VSL and video-marketing competitors have mostly invested in generative video AI and AI captions or transcription as standalone selling points. Stage 3’s integrated direction is a different bet.
Between stages: the research that opened Stage 3
The team split on what to do next. I ran two pieces of research on my own initiative.
Finding 1 — analytics inform, but don’t drive action. Sessions with analytics engagement included a video change28.56% of the time. Sessions without:35.96%. Checking stats and making changes are different use cases, not one flow.
Finding 2 — discoverability, not value, was the blocker. Against non-AI features in the same environments, AI’s discovery sat low-to-mid despite being far more visually prominent than anything it was measured against.
That reframed Stage 3: stats should inform changes rather than sit apart from them, and more entry points wouldn’t fix a problem that was never about entry-point count.
Sessions with video changes, by analytics engagement.
Discovery and adoption by feature, vid settings environment.
Alternative reads on Finding 1, and how I checked them
Coming out of Stage 2 the team agreed the standalone direction had ceiling problems. Where opinions split was on what to do next: more entry points to the existing surfaces, or a more drastic rethink.
Selection effect — analytics-checkers and fixers may simply be different cohorts. I filtered by profiling answer in Mixpanel to segment by who the user is, and found no sufficient difference between cohorts.
Measurement window — action may take longer than the session captured. I re-ran the funnel analysis with a much wider conversion window; the difference wasn’t sufficient either.
Neither explains the gap fully, and the magnitude is consistent across cohorts. I raised the finding in a weekly performance review, where it sat in the team’s open-problem list for a while before Stage 3 picked it up. The question was never whether the gap was real — it was what to do about it.
Finding 2 in detail: the two environments
I built funnels comparing AI features against non-AI features of similar complexity in the same environments.
In vid settings, the Script Analyser had low discovery (10.56%) and the lowest adoption of anything measured (21.05%), against features like Tags at19.59% discovery and43.70% adoption. That reinforces that the analyser had a deeper problem than discovery alone.
In vid stats, the AI assistant’s discovery sat mid-range (13.01%) while being far more visually prominent than any comparison feature, but adoption at53.13% sat in the upper-mid range and read well against its environment. The vid stats pattern is the one Stage 3 was built around.
Cohort analysis on users who did adopt AI features showed a recurring pattern: led in by curiosity, stayed because they saw value.
The banner-blindness read, and why clean attribution wasn’t needed
Three alternative reads I worked through: placement (not isolable without an A/B test we couldn’t run at production scope), function clarity — “Script Analyser” not communicating what it did (label test deferred to post-launch), and AI novelty effect (cohort comparison planned at 30/60/90 days).
My read on the dominant cause: the entry points named the wrong thing. They named a category — “AI” — at the gate to value. The most plausible mechanism is that users had absorbed a pattern across other products where AI buttons are vague-capability markers, and our buttons inherited that association even though our AI did real work. The button promised a category many users had learned to skip, and the value behind it stayed invisible until they clicked.
Stage 3’s design hedges against all three reads at once, so clean attribution wasn’t needed to move forward.
Stage 3 — AI as integrated enhancement
Both findings pointed the same way: AI should fill the data-to-action gap inside the interfaces users already open. The diagnosis landed. Disagreement showed up in execution.
My first attempt embedded AI inside the metric cards, each surfacing an “improve this metric” CTA on hover. The senior PM pushed back and was right: variance in our data is too large to tie a setting change to a metric outcome. That CTA promises what the system can’t deliver, and if the metric didn’t move we’d have damaged trust at the most engaged surface in the product.
I redesigned around it. The shipped version is a dedicated AI insights section between metric modules, separate from individual cards. Each card surfaces an observation and a suggested action the user decides on. The AI doesn’t claim more than it can deliver.
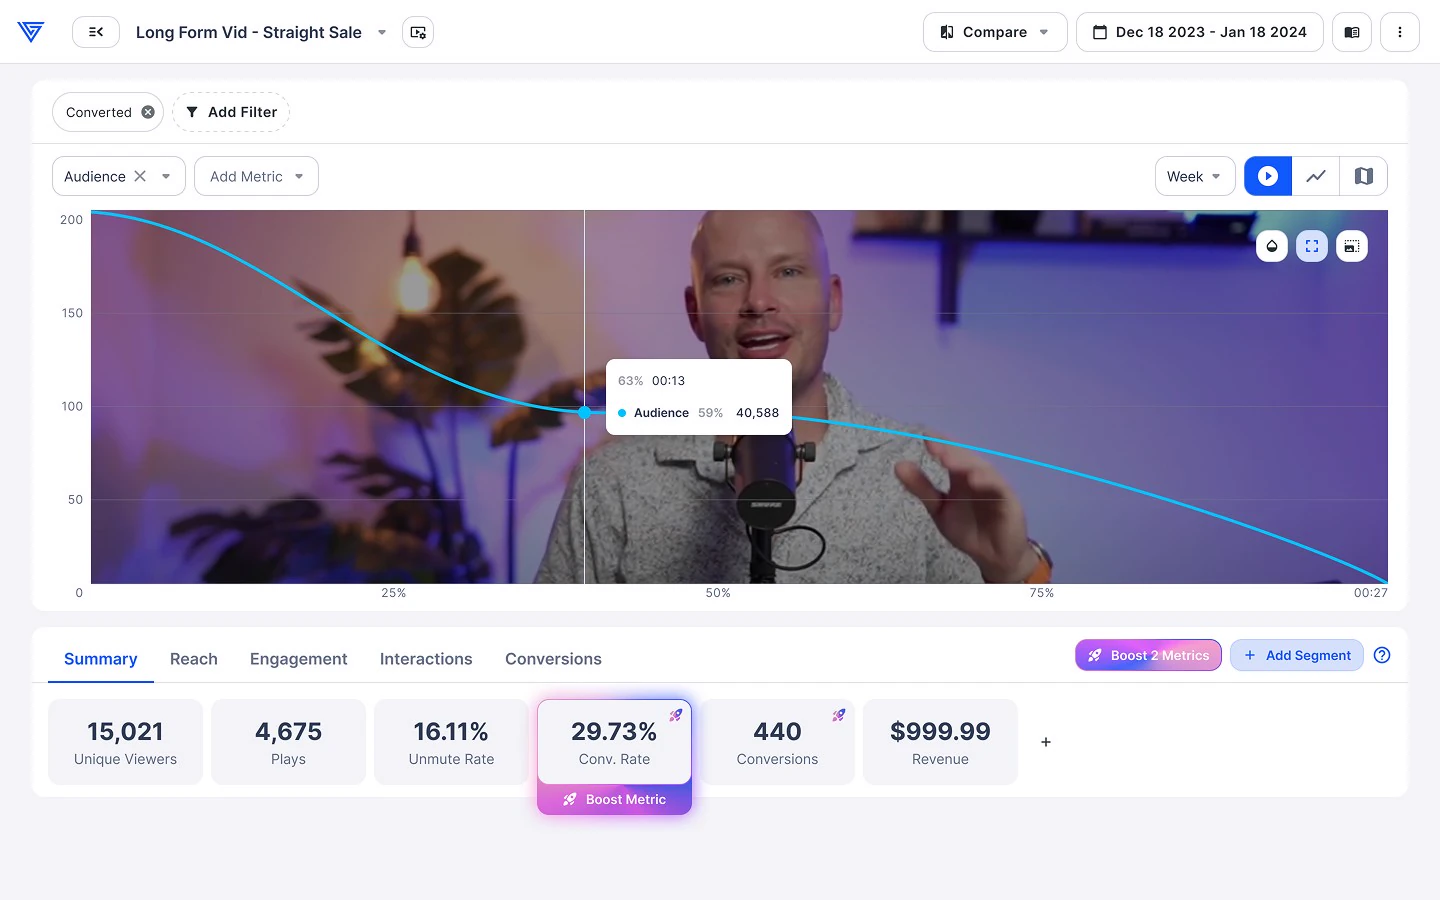
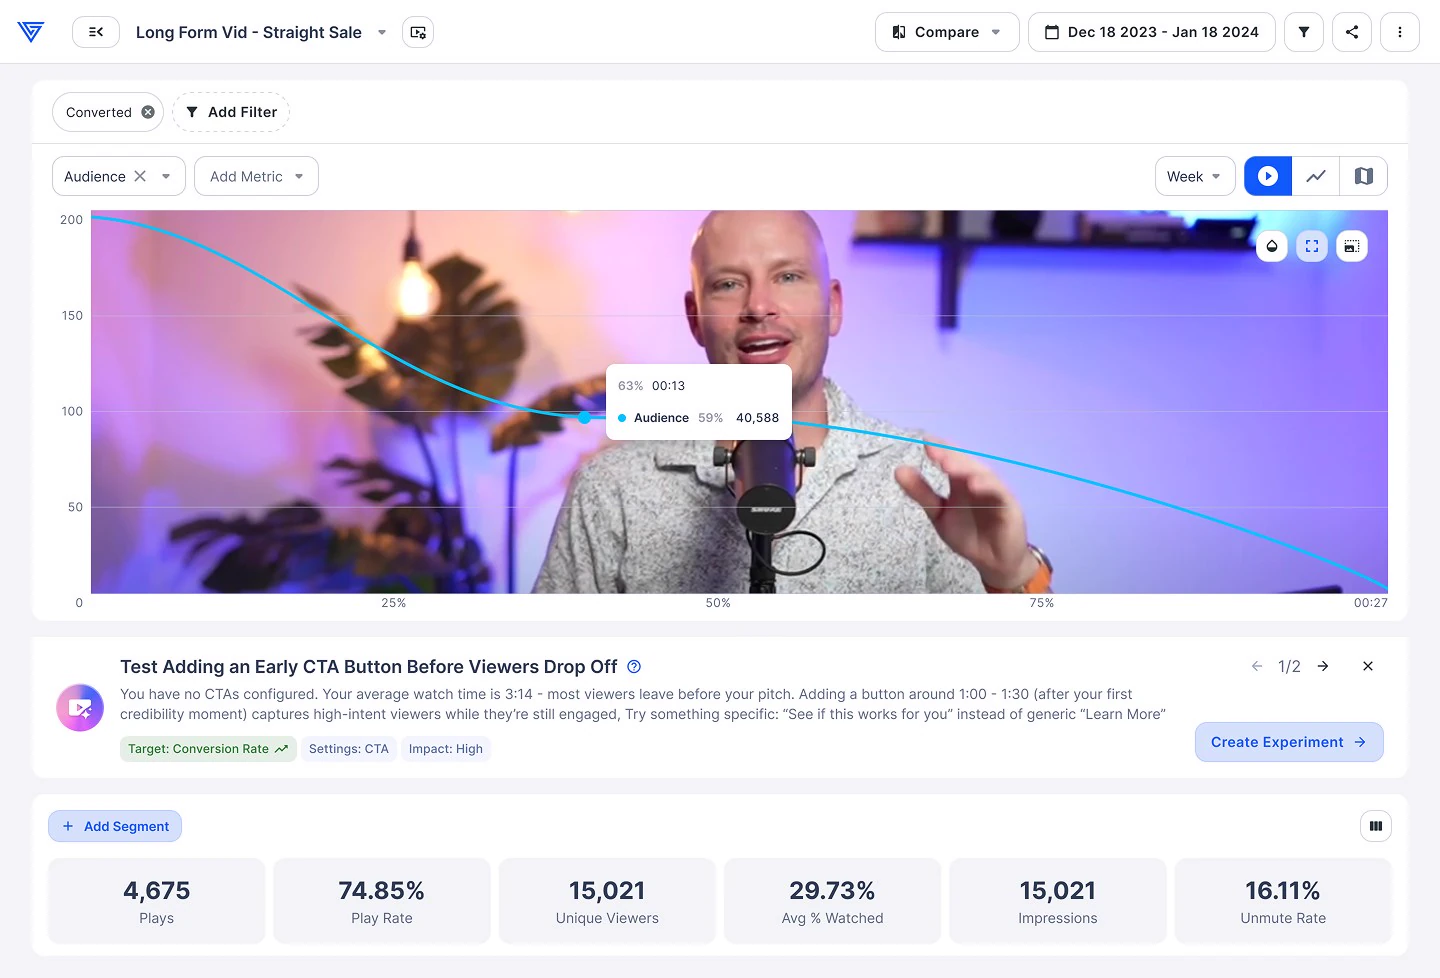
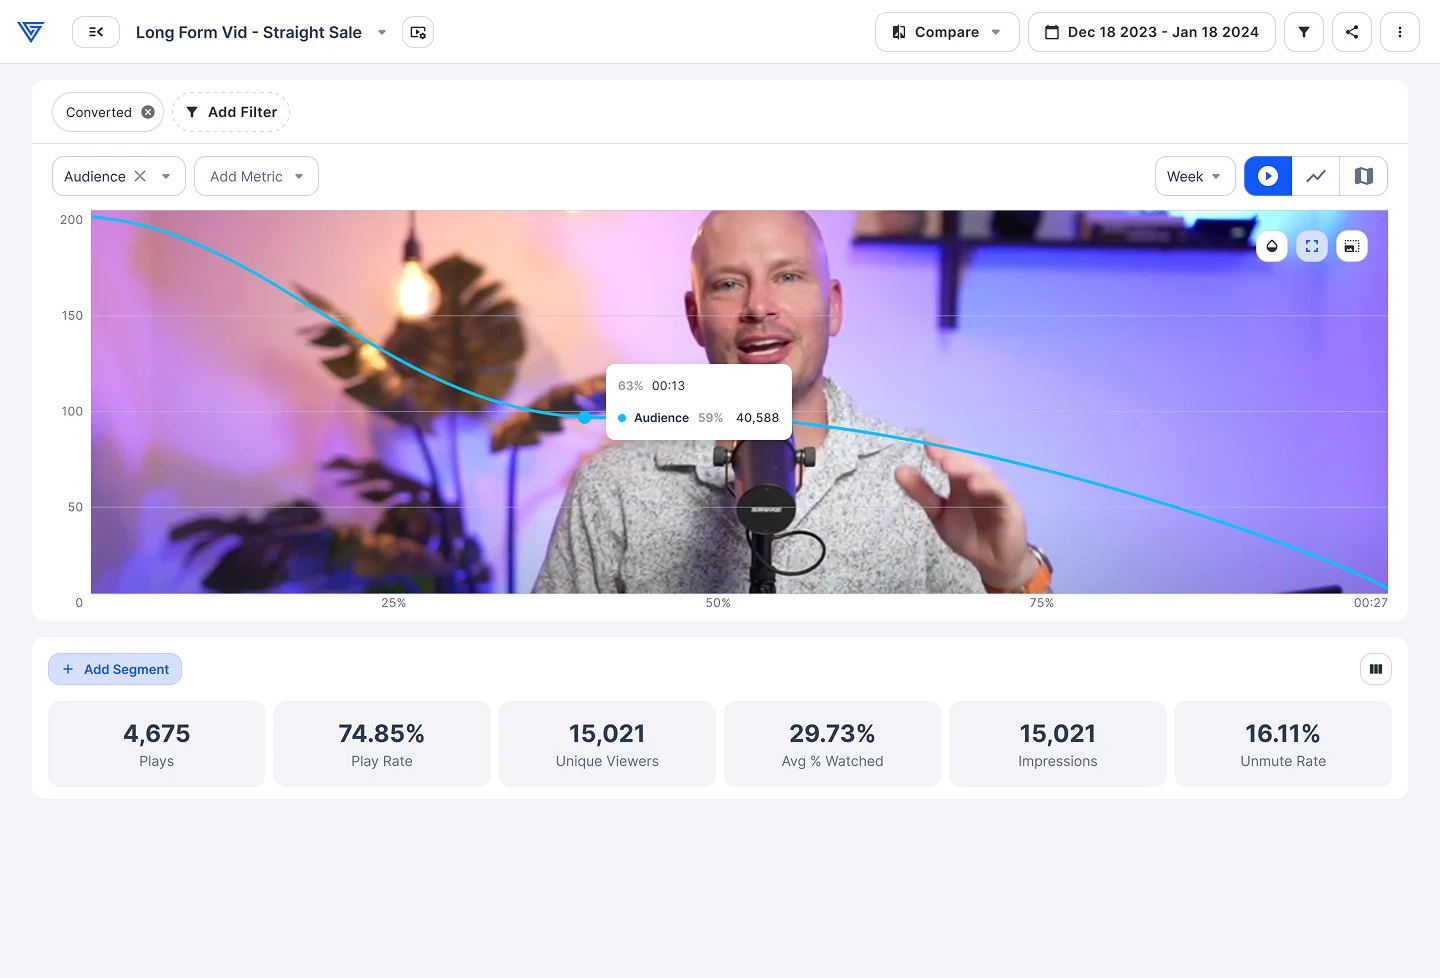
The first proposal, and vid stats before vs after.
Why cards rather than a chat
Stage 2’s chat depended on the user knowing what to ask. Cards don’t. The user doesn’t have to know what to ask, click anything, or commit to “AI” before reading what’s there. The value is on the surface.
This was structurally important given Finding 1: when users don’t know what to ask in the first place, a chat surface is the wrong primitive. Cards meet users in the rhythm they already have with the dashboard.
We label cards as “AI Insights” (observations) and “AI Experiment Suggestion” (proposed tests), with a gradient that signals AI in our visual language. We don’t hide what’s algorithmic — users should know what’s AI so they can calibrate trust. The difference from Stage 2 is where the labelling sits relative to the value. In Stage 2, users had to click an AI-labelled button before seeing what was inside. In Stage 3, each card already shows its specific outcome, so the AI label is descriptive context rather than an entry gate.
Other directions we ruled out
A more prominent chat than Stage 2’s — same blank-page problem.
More entry points to the existing standalone surfaces — the discoverability research said the ceiling was about category-named gates, not entry-point count.
Contextual notifications — off-brand for an analytics product where users open the dashboard to look at their data. Cards meet users in the rhythm they’re already in; notifications interrupt it.
Placement and hierarchy
Within vid stats, the AI insights section sits between metric modules. It had to hold two content types — insights (observations) and experiment suggestions (proposed actions) — and I kept them in one section because splitting them would have created two AI-flavoured zones, undermining the one-integrated-layer intent. The section is meant to be a single place connecting data to action.
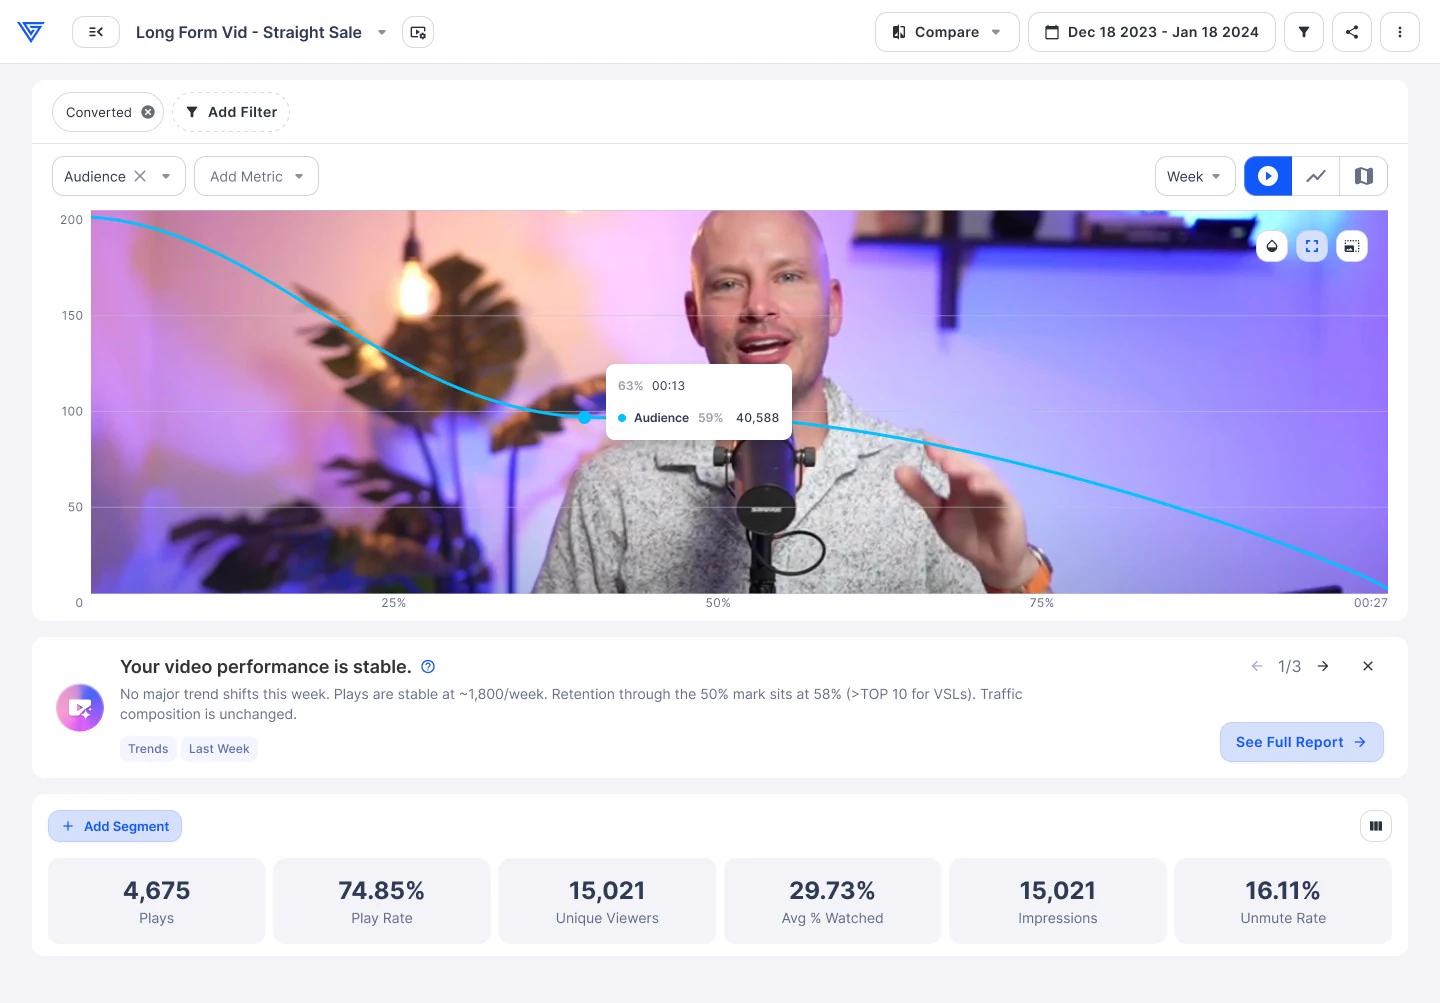
The AI insights section in place.
The A/B test handoff
Accepting an AI experiment suggestion doesn’t launch a test. It opens the regular setup flow with every field pre-filled, and the user reviews, edits and launches it themselves.
This is the user’s money — a wrong A/B test on a high-traffic VSL costs real revenue. One-click transfers accountability that doesn’t belong with the product: if the suggestion is wrong and we let them one-click it, we’ve cost them money through a flow we designed.
What the review step buys, and what I lost
Going through the pre-filled flow makes the user understand what’s being proposed and why. By the time they hit launch, they own the decision. I argued for the review step on accountability grounds and the team agreed.
I also proposed marking each pre-filled field with a small AI indicator. The PM declined for v1: the interaction model would have required logic-heavy handling per field type, and development cost outweighed the benefit under the launch-fast-and-cheap principle. If users get confused about field provenance, the indicator is the first thing I’d add.
How the AI decides what to show
Two generation approaches, scoped to match how reliable each content type needs to be. The PMs owned prompts and templates with engineering; the structure matters here because it shapes the surface.
Experiment suggestions come from a predefined library of test types agreed with engineering — CTA changes, thumbnail tests, intro length variants, pricing display tests. The model picks from a known set rather than generating novel ideas. The library broadens based on data over time.
Insights use templates with AI-filled variables. The structure is fixed (observation → metric → recommendation) and the model fills the specifics for each user’s data. Specificity per user without unbounded variance.
The split is deliberate. Experiment suggestions need to be safe, because a bad one can cost real money if it slips past review, so a bounded library is the safer pattern. Insights are lower-stakes and benefit from the model’s ability to reflect user-specific data.
The split is invisible to users but shaped card structure: experiment cards have a fixed schema so review is fast and trustable, while insight cards have variable layouts so specificity reads as specificity rather than noise.
What we cut to ship cheap and fast
Visual richness. Original mocks had embedded micro-charts — sparklines, small conversion graphs. Engineering flagged rendering cost as too high for v1. Dropped in favour of cleaner text-and-number cards.
AI onboarding. I proposed contextual onboarding for the section; PM declined for v1 on cost grounds. Ship without it, watch the data, revisit.
Pre-filled field indicators. Proposed, declined for development complexity.
Coverage. Vid stats only, not every dashboard. Vid stats had the clearest AI use case and the highest engagement.
Insight count and types. Capped at one insight per video, with a smaller library than the roadmap envisioned. Ship a working set, expand based on data rather than speculation.
What shipped, and what happened
Two things came out of Stage 3. AI experiment suggestions went live on 13 May 2026 and AI insights on 2 June 2026. I owned both end to end.
AI insights
Adoption reached20.13% of eligible users, which is a strong number for our app, and retention is holding. I am not putting a retention figure here — the feature has not been live long enough for one I would defend.
Around82% of ratings on the reports are positive. Too few ratings have been given for that to be more than an encouraging signal, and I would not present it as a result yet.
There was no A/B test. Whether users act on an insight is still being measured; there isn’t enough data to answer it from behaviour alone, so the next step is qualitative — surveys and interviews with users who have seen them.
AI experiment suggestions
The suggestion appears in vid stats and is triggered when a video has enough traffic and enough conversions for the system to make a confident proposal, generated from that video’s own data. Accepting one opens the pre-filled experiment setup described above.
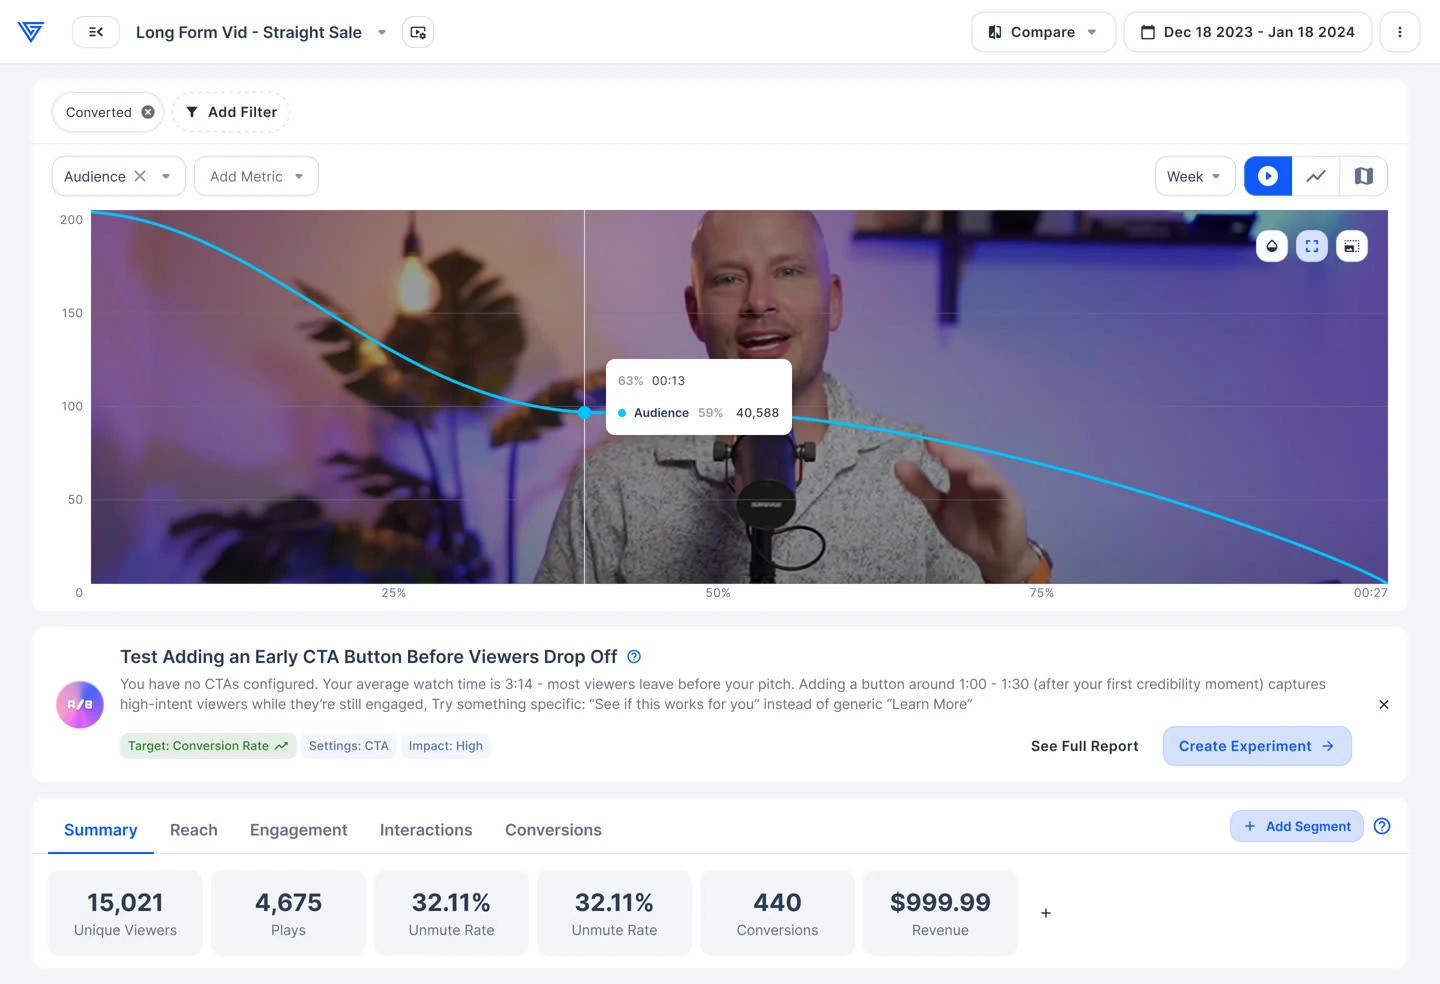
A suggestion in place: what to change, why, and the expected target.
It underperforms. Of the users who respond to a card at all, the split is 72/28 in favour of dismissing it. Measured against every suggestion shown rather than every response, the funnel is thinner still: 56 shown, 2 opened the setup, 2 created an experiment, 1 started it.
Experiment suggestions, last three months. Percentages are of suggestions shown.
The users who do engage go on to launch experiments, which says the suggestions themselves are sound. Two things sit underneath the number. Eligibility is genuinely narrow — a video needs 100+ daily plays to qualify at all, and realistically 500+ before running a test beats simply making the change — so the addressable ceiling is low by design.
The second is placement, and it is the more useful finding. Later research showed that vid stats is a diagnostic surface: people go there to understand what happened, not to decide what to do next. Proposing a change there interrupts the wrong task. The next move is to aggregate suggestions on the experiments home page, where the user has already decided to act — shown when they are wanted rather than when they are a distraction.
What’s next
The next chapter is an AI agent that lives across the whole app rather than on one page — reachable from every screen in Vidalytics, offering the actions relevant to that screen. It is in development now. I am not the owner; I consult on the UI and act as a second voice through the process.
It descends from what these stages established, but the honest framing is larger than that: it is part of a company-wide move toward an AI-native product, a direction set by management and by where the market is going. What this work contributed is the evidence for how to do it — that a model is not a feature, that an AI surface has to state what it can do before anyone will use it, and that where you put it decides whether it gets used at all.